In an age of global warming/ heating/ boiling it is important to have a basic understanding of a few chemicals. Methane is one of them.
A chemical compound is a substance made of many identical molecules containing atoms from more than one chemical element, held together by chemical bonds. There are several different types of chemical bonds, but those will not be discussed here, but the next time a chemical is presented.
Atmospheric oxygen = O2 is not a compound because there are atoms of only one element present, two atoms of oxygen joined together. Water = H20 is a chemical compound. It consists of two hydrogen atoms and one oxygen atom. A compound can be transformed into a different substance by a chemical reaction, typically involving interactions with other substances, and where bonds between atoms may be broken and/or new bonds formed.
Natural gas is not a compound, but a naturally occurring mixture of gaseous hydrocarbons consisting primarily (typically 97%) of methane. The chemical formula for methane, CH4, indicates that it is a compound, with one carbon atom bonding with four hydrogen atoms to create a methane compound. Natural gas/ methane used to be considered a clean-burning bridge fuel, an intermediate step between coal and renewables, to reduce emissions. Such a pleasant fantasy.
Radiative forcing = climate forcing = a climate science concept to quantify the change in energy balance in the Earth’s atmosphere caused by various factors, such as concentrations of greenhouse gases, aerosols, and changes in solar radiation. Technically, it is the change in the net = downward minus upward = radiative flux (expressed in W/m2) due to a change in an external driver of climate change. Both carbon dioxide (CO2) and methane (CH4) are examples of external drivers. Most of the atmosphere is made up of nitrogen (N2) in addition to about 21% oxygen (O2).
The International Energy Agency 2024 methane tracker chart (below) shows the countries with the worst methane emissions from their oil and gas industries. At the far end of the chart is Norway which releases 0.01% well to end use emissions.
Worst in class is the United States, which is also the world’s largest producer of gas and oil by volume. USA produces 943.2 Gm3 of natural gas, compared to second-place Russia’s 701.7 Gm3. Canada’s sixth-place produces 172.3 Gm3, and Norway’s 11th place produces 11.43 Gm3. The natural gas figures are from The CIA World Factbook, 2021. From the same source, one can read that USA produces considerably more oil than than second-place Russia, and third-place Saudi Arabia. Part of the reason for United States’ position is its unconventional oil and gas extraction with shale oil and fracking. Both lead to high methane emissions.
For over fifty years, I have been one of those lummoxes who refuses to use non-metric units. For example, most days I refuse to use figures like 13.5 million tons, or even the quasi-metric equivalent expressed in tonnes. 1 ton = ca. 907 kg. Instead, I convert the original quantity to something metric. In this case 12.25 Tg.
The use of metric prefixes dates back to the definition of kilogram after the French Revolution. Currently there are 24 prefixes in use, ranging from quecto- (q) = 10 -30 to quetta- (Q) = 1030. Quecto, ronto (10-27), ronna (1027) and quetta were added in 2022. Wikipedia has an enjoyable (at least for some of us) article about metric prefixes.
Methane is a gas, so it is necessary to understand how gasses are measured. It begins with pressure. The standard atmosphere (atm) is an American unit of pressure defined as 101325 Pa = 101.325 kPa. While the Pascal is an SI unit, most metric users will call the standard atmosphere 1 bar, more accurately 1.01325 bar. Both of these units refer to a standard pressure, approximately equal to Earth’s average atmospheric pressure at sea level.
Methane is a colourless and transparent gas. It has a boiling point of −161.5 °C = -258.7 °F (read: deadly cold) at a pressure = 1 atm. As a gas, it is flammable over a range of concentrations (5.4%–17%) in air at 1 atm.
Methane is also odorless. The smell of natural gas some people experience at various locations is caused by the addition of an odorant for safety purposes. Usually the odorant is tert-butylthiol = tert-butyl mercaptan (TBM) = (CH3)3CSH often abbreviated t-BuSH. Given a choice, most people prefer to smell an odorant, alerting them to a gas leakage, than to die in an unannounced gas explosion.
Methane does more damage in the atmosphere than carbon dioxide. Thus the twenty year global warming potential (GWP-20) = 81.2. That second number is used to convert the pollutant into a CO2 equivalent. In the case of methane, GWP-100 = 27.9, is significantly less because methane has a much shorter atmospheric lifetime than carbon dioxide. Thus, 12.25 Tg of methane has the effect of 994.7 Tg GWP-20 of CO2. Despite it not being totally correct, I am going to refer to this as its 1 Pg GWP-20 C02 equivalent. The GWP-100 value is 340 Tg. The world’s total carbon dioxide emissions are about 40 billion tons a year = ca 3.6 Pg/ year.
The most common chemical reactions of methane are combustion, steam reformation of synthetic gas and halogenation.
Combustion, is an exothermic redox chemical reaction between a fuel = reductant and an oxidant = most often atmospheric oxygen, that produces oxidized, often gaseous products. Redox = reduction–oxidation = chemical reaction where oxidation results in the loss of electrons while reduction results in a gain of electrons. Exothermic means the reaction releases energy from the system to its surroundings, usually in the form of heat.
CH4 + 2O2 → CO2 + 2H2O
Steam reforming to synthetic gas (syngas) is an endothermic process = a chemical/ physical process that requires/ absorbs heat from its surroundings. Endothermic is the opposite of exothermic. In this case, there is a need for energy ( 206 kJ/mol of methane) for the reaction to take place:
CH4 + H2O → CO + 3 H2
Halogenation is a chemical reaction that entails the introduction of one or more halogens into a compound. Halogens form a group (#17) a column of elements with similar characteristics, in the periodic table. They consist of five (or six) chemically related elements from top = lightest, to bottom = heaviest, atomic mass. Their symbols, atomic number = position and approximate atomic mass/ weight are: fluorine (F #9, 18.998), chlorine (Cl #17, 35.45), bromine (Br #35, 79.904), iodine (I #53, 126.9), and the radioactive elements astatine (At #85, 210) and tennessine (Ts #117, 294). Not all chemists accept tennessine as a halogen. The word halogen = salt former = salt maker. When halogens react with metals, they produce salts. Think: NaCl (sodium chloride) or common table salt. Sodium (Na) is a metal, chlorine (Cl) is a halogen.
CH4 + Cl2 → CH3Cl + HCl
Note: This is not the first chemical I have written about. Earlier, I wrote a weblog post about silicone.
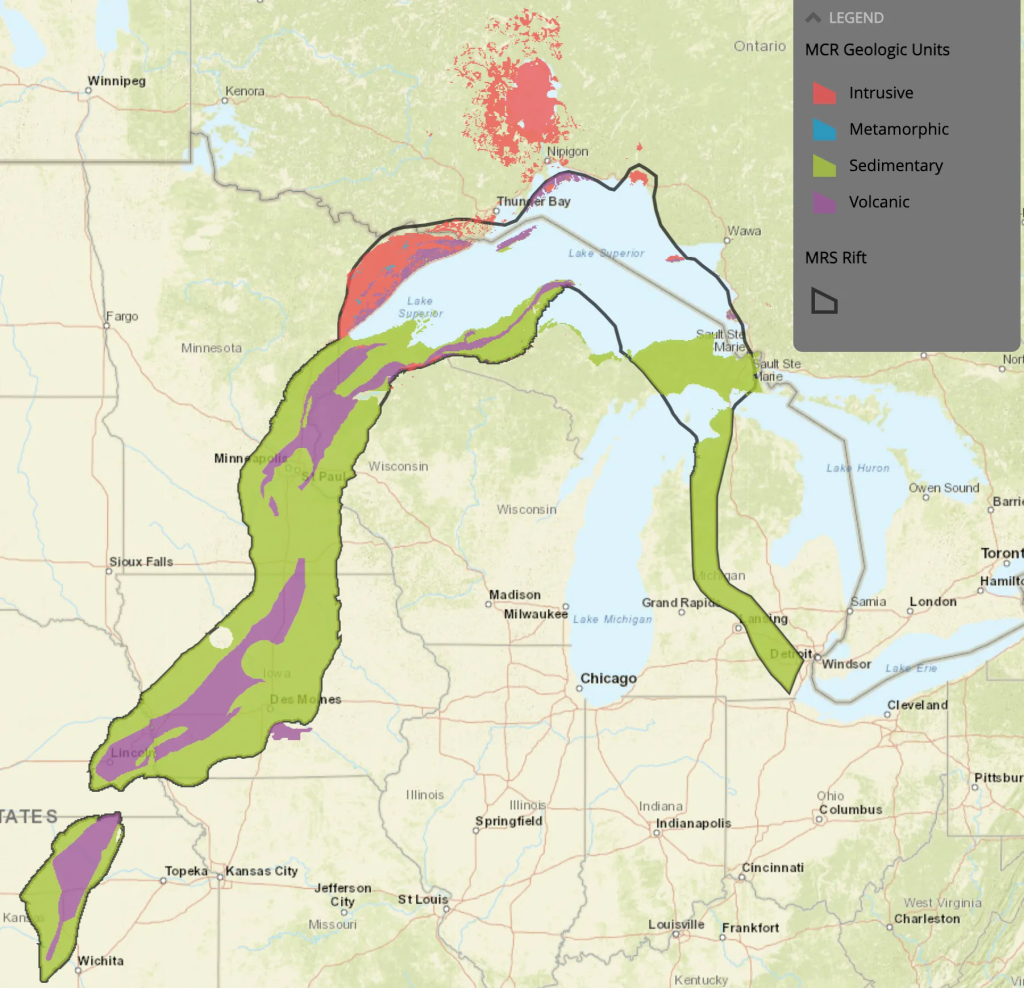
The Mid-Continental Rift System, where white hydrogen could be produced. Source: United States Geological Survey, 2023-12-05
Hydrogen is an important element in a number of compounds, including water (H20), methane (CH4) and ammonia (NH3). In my opinion it is not an effective energy carrier. The accessible energy is stored in electrons.
One hypothetical question about hydrogen is to ask if pipelines should be built to move H2 to other places, or if it is better to move electrons using high-voltage direct current ( HVDC) transmission? It is hypothetical because no energy analyst without a vested interest in pipelines, would bother to ask the question. They know the answer is HVDC.
One avoids a lot of confusion, if the starting point for understanding energy transmission is exergy. Two (slightly modified) paragraphs from Wikipedia can provide a foundation, even if it takes time for one’s brain to understand the concept: Exergy, often referred to as available energy or useful work potential, is a fundamental concept in the field of thermodynamics and engineering. It plays a crucial role in understanding and quantifying the quality of energy within a system and its potential to perform useful work. Exergy analysis has widespread applications in various fields, including energy engineering, environmental science and industrial processes.
From a scientific and engineering perspective, second-law [of thermodynamics] based exergy analysis is valuable because it provides a number of benefits over energy analysis alone. These benefits include the basis for determining energy quality (or exergy content), enhancing the understanding of fundamental physical phenomena, and improving design, performance evaluation and optimization efforts. In thermodynamics, the exergy of a system is the maximum useful work that can be produced as the system is brought into equilibrium with its environment by an ideal process. The specification of an ‘ideal process’ allows the determination of ‘maximum work’ production. From a conceptual perspective, exergy is the ideal potential of a system to do work or cause a change as it achieves equilibrium with its environment. Exergy is also known as ‘availability’. Exergy is non-zero when there is dis-equilibrium between the system and its environment, and exergy is zero when equilibrium is established (the state of maximum entropy for the system plus its environment).
One assumption, in both papers, is the existence of a large source of green hydrogen molecules available at a single location suitable for putting into a 1 000 km pipeline. Hydrogen plants, close to existing pipelines, don’t use green hydrogen but grey hydrogen based on a centralized natural gas steam reformation system. For a short explanation of hydrogen’s colours scroll down to the end of this post.
The papers assume green hydrogen is inexpensive to manufacture: $1 per kilogram in the 2018 study; $2-$4 per kilogram per the 2021 study. Yet, green hydrogen uses 50 – 60 kWh of firmed electricity per kilogram to manufacture. Firmed electricity costs about $0.10 per kWh, unless one is using massive legacy hydroelectricity facilities found in Norway, Quebec and British Columbia. Here $0.5-$0.06 per kWh could be found. Firmed is a term used to describe energy that can be constantly provided at a needed rate and at a fixed cost.
A better estimate of the manufacturing cost of hydrogen is $5 to $10 per kilogram.
There are also incorrect assumptions about the capacity of HVDC transmission lines, underestimating capacity. In 2019, a Chinese 1 .1 MV = 1 100 kV link was completed. It traverses a distance exceeding 3.3 Mm = 3 300 km = 2 100 miles with a power capacity of 12 GW.
At the end of every line (pipe, as well as transmission), energy has to be distributed onward. Electricity is part of a high efficiency (read: cheap) distribution grid. Hydrogen is expensive to distribute, often relying on trucks with specially made pressurized tanks. While gray hydrogen costs $1-$2 to manufacture, it currently sells for €15 to €25/ kg to consumers in Europe and $30 to consumers in California. Much of this difference in price is due to distribution costs.
Both papers ignore that hydrogen as an energy carrier has to be used. Molecules are less efficient than electrons. Fuel cells offer only about 50% efficient in turning H2 into electricity, while electricity stored in batteries is much more efficient.
Burning hydrogen for heat under 200° C = 392 ° F competes directly with heat pumps, which are three times as efficient on average, and in industrial settings usually even more efficient. This means there is no need for H2 for residential or commercial heating.
The vast majority of industrial processes working above 200°C are electrifiable, typically with efficiency gains over using burnable fuels. The hydrogen pipeline studies ignore this inconvenient truth.
A Norwegian DNV (previously Den norske veritas) study, Specification of a European OffshoreHydrogen Backbone (2023) produced a report for The European Association of pipelines. It is slightly more realistic than the 2018 and 2021 studies, but still contains major flaws. It contends that green hydrogen can be delivered to the end of a transmission line for €3.21 per kilogram in 2050, and that this is cheaper than the transmission of electrons. It uses more expensive HVAC transmission rather than HVDC transmission, and exaggerates these transmission losses compared to hydrogen pipeline efficiencies. They also overstate transmission line operating costs, despite the fact that HVDC has no moving parts while pipelines have lots of moving parts, such as pumps.
Despite all of the unrealistic benefits given to H2, it’s still ten times more expensive to transport than liquid natural gas (LNG). Michael Barnard commenting on the report in CleanTechnica, contends that the report “was structured to meet the need of the clients to pretend that manufacturing molecules of hydrogen offshore at wind farms and then constructing pipelines all the way to major demand centers was the most cost effective model, and the DNV analysts contorted numbers and the space time continuum until the client’s needs were satisfied.”
Hydrogen pipelines vs. HVDC lines:Should we transfer green molecules or electrons? (2023) by the Oxford Institute for Energy Studies is better. It starts with the same amount of electricity at the beginning of the pipeline and HVDC = 9.6 GWh. They then apply most electrolysis facility energy losses before putting hydrogen into the pipeline, and apply the much smaller efficiency losses to electricity before it gets into transmission.
They calculate the energy delivered at the end of the pipeline to be 1.15 – 5.71 GWh , with an average value of about 3.4 GWh or a 34% delivery rate. At the end of the transmission line, there is 7.872 – 8.832 GWh, with an average value of 8.35 GWh or 87% delivery rate.
Yes, there is considerably more energy at the end of the transmission line. The hydrogen pathway delivers only 40% of the energy compared to the electron pathway. In economic terms, that means that energy from H2 will cost 2.5 times what it costs using electricity.
Much of the rest of the report can be filed under magic/ apologetics for the H2 industry, with unsupported contentions, and unrealistic costs: too little for hydrogen, but too big for electricity.
Other weaknesses in the report include failure to explain how one can get firmed electricity in sufficient quantities to an offshore electrolysis facility economically, or to take into account construction costs. In addition, electrolysis is simplified, missing several components such as a hydrogen dehumidifier.
At the other end of the pipeline, exergy is not taken into account. They treat the energy delivered as molecules and the energy delivered as electrons as being equal. Fuel cells are only 50% efficient at turning hydrogen into electricity. This means that using hydrogen requiring 5 times as much electricity, in contrast to using electricity directly or with intermediate storage using batteries or capacitors. To produce heat < 200° C, 7.5 times as much electricity is needed, For heat > 200° C, an electric option is almost always more efficient.
I will not state that there is no market for hydrogen for energy, and look specifically at the aviation industry. However, there are no hydrogen pipelines planned (that I can find), although some designs exist. There are many HVDC transmission lines approved, under construction and in operation.
There is a market for H2 as a feedstock/ commodity. In the United States the most economical way of producing it is to pump water down to hot iron-rich rock to extract white hydrogen in the Mid-Continental Rift System (MRS) = Keweenawan Rift. This can be done at an industrial scale. The rift is about 2 000 km = 1 200 miles long, in the center of the North American continent but south-central part of the North American plate. It formed when the continent’s core = the North American craton, began to split apart during the Mesoproterozoic era, about 1.1 billion years ago. When the rift failed, it left behind thick layers of igneous rock that are exposed in its northern reaches, but buried beneath later sedimentary formations along most of its western and eastern arms. This rift is also an important location for metals, but that is a topic for another day.
Conclusion: It makes no economic sense to put electrons into electrolyzers to make H2, then to put that H2 into pipelines. Hydrogen is an ineffective carrier of energy. No hydrogen pipelines will be built to transport energy. HVDC transmission lines will carry electrons everywhere. If H2 is needed as a feedstock, it will be manufactured at the point of use, to avoid transportation costs.
Notes: The various colours of hydrogen are a shorthand way of discussing hydrogen production characteristics. These were listed in an earlier weblog post, although white hydrogen was missing. In summary these are: black/ brown = from coal; grey = from methane/ natural gas; green = from surplus renewable energy; yellow = from solar (my personal usage, others use orange); orange = from mixed sources, including up to 50% non-renewables; red = from mixed sources where non-renewables exceed 50%. pink = from nuclear energy; turquoise (in general use) = purple (my personal usage) = more climate friendly blue hydrogen, such as methane pyrolysis. White (or gold) = hydrogen made by natural processes.
WindCORES is best described as a project, founded in 2018 and based in Germany, that operates data centres inside two wind turbines, making them almost completely carbon neutral. This means that previously unused space becomes usable, even valuable. These data centres are powered by the same wind turbines, while fiber optic cables provide internet connectivity.
The concept began about 2013, when WestfalenWIND realized the electricity grid was too weak to handle the electrical power being produced by its wind turbines during peak wind hours. This meant that power from windfarms was switched off due to grid security issues. WindCORES estimated that this unproduced/ undistributed electricity could power one-third of all German data centers
Wind power that never enters the grid is fed to servers located inside formerly empty, large concrete wind turbine towers. Each tower is typically 13 meters in diameter, and could potentially hold servers throughout most of their 150 meters height. On average 85-92% of the power needed to sustain such a data center comes directly from the host turbine. When there is no wind, electricity is obtained from other renewable sources, including solar farms and hydroelectric power plants, via the electricity grid. It is claimed that a typical German data center releases 430 grams of CO2 per kilowatt hour. WindCORES servers will release 10 grams.
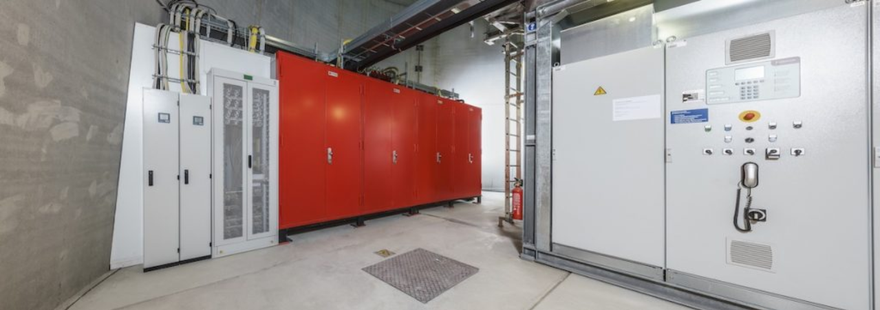
Currently, windCORES has a fully operational data centre in a wind turbine in Paderborn, a city in eastern North Rhine-Westphalia, Germany. Initially, For IT, WestfalenWind IT and Green IT installed four fire-resistant IT safety cabinets, housing 62U server racks, with Fujitsu’s Primergy servers and Eternus storage units.
It has about 150 customers of varying size, co-located in the towers offering cloud solutions. Zattoo, is one of these. It is a carbon-neutral Swiss TV streaming platform with several million monthly. Zattoo joined windCORES in 2020, when it moved one of its six data centers into a wind turbine, 218 channels are encoded with windCORES . By the end of 2024, Zatoo plans to relocate more existing servers to the wind farm, making it Zattoo’s main data center location.
WindCORES has recently opened a larger, second location called WindCORES II at Windpark Huser Klee, a 50.85 MW onshore wind power project, also located in North Rhine-Westphalia, but at Lichtenau. The windfarm was commissioned in 2015. The data centre was built for BMW, occupying three levels (20 meters) of space.
Reflection
Some µs after I had typed in the title of this weblog post, I wondered if it should be changed to A in B. After all, the local bus company is called AtB, which in the local trøndersk dialect means A to B. Yes, this dialect specializes in shortening words, so they are barely understandable, even to other Norwegians. While A and B refer to random locations/ stops in the bus network, A refers to any type of product that can be made or stored in a container B, in the original example. More specifically, my reasoning was that readers could be asked to reflect on: What can be housed in a wind turbine mast? or, possibly: Where can data centres be located? In the end, I decided to take the easiest action and do nothing.
There is no reason why other companies in other places in the world could not open data centres in existing wind turbines, even in Trøndelag.
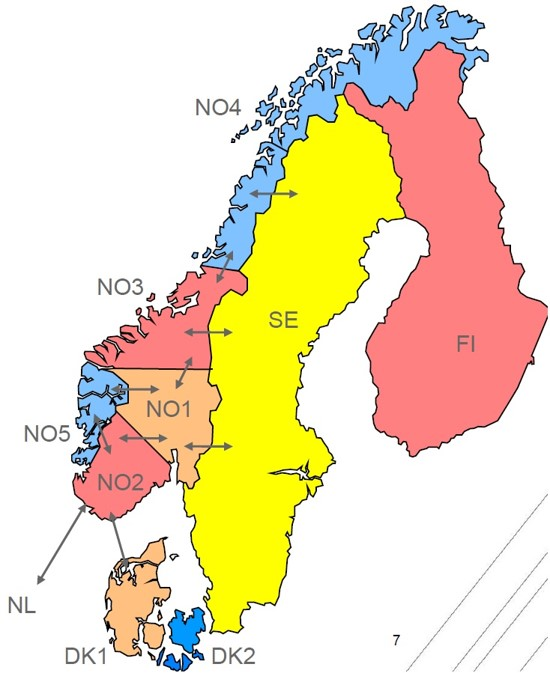
The energy price zones in the Nordic Countries. Norway distinguishes itself by having five zones with a population of 5.5 M. Denmark with 5.9 M has two. Finland with 5.5 M and Sweden with 10.6 M just have one, each.
Electricity for me has always meant hydroelectric power. Wikipedia tells us: In 1878, the world’s first hydroelectric power scheme was developed at Cragside in Northumberland, England, by William Armstrong. It was used to power a single arc lamp in his art gallery. The old Schoelkopf Power Station No. 1, US, near Niagara Falls, began to produce electricity in 1881. The first Edison hydroelectric power station, the Vulcan Street Plant, began operating September 30, 1882, in Appleton, Wisconsin, with an output of about 12.5 kilowatts. By 1886 there were 45 hydroelectric power stations in the United States and Canada; and by 1889 there were 200 in the United States alone.
In 1895 the Norwegian government purchased its first waterfall, Paulenfossen, to produce electricity for the Setesdalsbanen railway line. These are both located in the south of Norway, close to Kristiansand. In the early 20th century, the government purchased the rights to many more waterfalls to produce electricity for industrial use. In 1921, the Norwegian Water Resources and Energy Directorate (NVE) was setup to construct and operate state-owned power plants.
Over the next 70 years, a vast number of small, medium and large-scale hydropower installations were built. Svartisen power plant in Nordland, opened in 1993. It was the last major plant build. Today, Norway has about 1 200 hydroelectric generating stations.
This weblog post looks at the Norwegian electrical energy/ power market, after the start of the war in Ukrainian. The European electrical energy market has been disrupted since the Russian invasion of Ukraine in 2022. It has affected countries differently. Here, the challenges facing Norway will be discussed. There are many different ways to look at this situation, many aligned with that individual’s role. Most people are consumers. For them, the root of the problem is the Norwegian government’s failure to impose a maximum price. Then there are investors, who use an artificially constructed market to profit from a war induced shortage of energy. In addition, the Norwegian government, as a major investor, has failed to tax these windfall profits. Instead, they use general taxation (and their own massive energy windfall profits) to subsidize some consumers, while ignoring other equally worthy groups.
ACER = Agency for the Cooperation of Energy Regulators, can be regarded as the European Union’s energy agency. Its intention is to ensure the free flow of electricity across national borders to smooth out variations in wind and solar power. It is particularly concerned about solar power which has a diurnal rhythm. Wind energy is more varied but also has a diurnal component that partially compensates solar energy. In contrast to this, hydroelectricity in Northern regions, has an annual cycle. Norway produces around 140 terawatt hours (TWh) with hydropower. In a year with normal rainfall, there is a power surplus of around 10 per cent, that is approximately 14 TWh. For Norway with hydropower, the Acer agreement does not work well.
To explain the relatively high Norwegian prices for electricity, the Norwegian government refers to the energy crisis in Europe and the war in Ukraine as an explanation for these prices. In 2020, long before the gas crisis, electricity customers in Denmark and Germany paid around NOK 3 per kilowatt hour, about six times the price in Norway. Electrical consumers have traditionally paid a lot less, because Norway built out an inexpensive hydroelectric power system. After the elimination of gas from Russia by unknown forces, possibly associated with Ukraine, they pay around NOK 4.
The water reservoirs in Norway have a natural cycle. In the spring before the snow melts, they are almost empty. During the summer, they are filled up so that they can provide electricity through the winter. There is a shortage of water in the reservoirs towards the end of winter.
The Acer agreement does not take this cycle into account. Instead, all the water Norway has in its reservoirs is seen as available power for Europe. The agreement does not take into account that the reservoirs must be filled before winter.
In contrast, if there is a lot of wind in one place, the local electricity price goes down and the electricity will then flow freely to areas with little wind and higher electricity prices.
With Acer, it is differences in electricity prices that determine where the electricity will flow, not a “desire” to import or sell. As long as the electricity price is slightly lower in Norway than in England and the EU, electricity flows out of Norway. For electrical exports to stop, the price must be the same on both sides of the cable.
For the last several years, Norway has exported significantly more than it electrical power surplus. The Norwegian government along with its control organization, NVE, a directorate under the Ministry of Petroleum and Energy, and its energy distributor blame low rainfall to explain the low degree of filling.
An awkward government and Statnett stand passively and watch power flow out of Norway at the same time as the reservoirs in southern Norway have a historically low level of filling. Statnett argues that the power cables used for export can also be used for import. In this way, delivery security is ensured. What they don’t want to discuss is if the price level will be significantly higher.
With the last two foreign cables, the export capacity from southern Norway was well over double the power surplus.
With new cables, Acer, the free flow of electricity, supply and demand in Norway no longer determines the price of electricity. Instead, it is determined in the EU and England, for the whole of southern Norway (NO1, NO2 and NO5). Central Norway (NO3) and Northern Norway (NO5) were initially shielded from European price levels, but this is gradually changing. A planned increase in transmission capacity between north and south will only contribute to higher prices in the north without lowering the price in the south.
More electricity to the south means more exports until the reservoirs in the north are also depleted and we get the same situation in the north as in the south.
Most Norwegians are willing to contribute electricity to Europe. However, the amount of power to be exported has to be determined by the Norwegian power surplus. The result of this export is an increasingly lower degree of filling in the water reservoirs. At some point, this draining of the magazines must stop.
Electricity prices in Europe will reach new heights in the winter and we will be forced to pay even higher electricity prices in Norway to get electricity back.
In a worst case situation, Norway will not have enough water in the reservoirs to get it through the winter. If that happens, the overseas cables do not have enough capacity to supply Norway with electricity, and one will end up with electricity rationing.
The Norwegian government is currently providing support mechanisms for consumers. It is perpetually investigating imposing maximum prices. Competition rules in the EU prevent electricity support mechanisms for business, although some exceptions have been made, especially for farmers. The result has been the elimination of power-intensive industry in the south of Norway.
The government says that investing in offshore wind and more renewable power will contribute to lower electricity prices. The development of more renewable electricity, in the form of wind or solar, in Norway is only intended to cover its own increased consumption. Norway will never have a power surplus corresponding to the transmission capacity of 35 TWh, which is what is needed for the market in southern Norway.
The EU has a colossal need for more renewable electricity in the coming years. Currently, only 10 percent of the EU’s energy needs are covered by renewable energy.
With the demand for a 50 percent CO₂ cut in the Paris Agreement, there is no reason to hope for lower electricity prices in the EU in the next 10 years. At the same time, there is no reasonable reason why southern Norway should have sky-high electricity prices. Most Norwegians are agreed that if lower electricity prices are to prevail in Norway, along with a stable power situation, the Acer agreement must be renegotiated or terminated.
Norway has voted twice against joining the EU, once in 1972 and then again in 1994.
Opposition to Norwegian membership in the EU is still strong, according to a survey carried out by the Norwegian Broadcasting Corporation (NRK) in 2023-03. This indicated that if a referendum was held then, 52% of those who responded said they would vote against membership of the European block. Only 27% would vote yes, while more of the rest said they most likely wouldn’t participate in a new referendum. Most Norwegians do not wish to cede sovereignty to the EU.
Norway is still integrated into Europe through its European Economic Area Agreement membership, which gives it access to the EU internal market. Norwegians have a general skepticism not just to big business, but to their own government!
Overseas cables are then used for power exchange and the sale of excess power without giving us European price levels. Just as Statnett promised us before the cables were put into operation.
Norway’s power surplus and net exports over time will be roughly the same without Acer, and Statnett will still receive income from sales abroad. Norway can still help fulfill the intention of the Acer agreement, that is to say help to smooth out variations in wind power. If it is very windy in England or the EU, we can accept excess wind power and at the same time reduce our own power production. It is very easy to turn off hydroelectric turbines. When there is little wind, we can give back the same amount of electricity. The whole exercise becomes a zero-sum game, profiting all participants.
In Norway the population is skeptical to politicians. Politicians of all colours are seen as aligning themselves with foreign investors to prey upon the weak. In this Norway is not unique.
Prices
Most Norwegian consumers opt for spot prices. We choose a fixed price. If one looks at our electricity bill in 2021, the energy component of 1 kW of electricity cost about NOK 0.20, while the infrastructure component was about NOK 0.30. Altogether, slightly over NOK 0.50. In 2022, the infrastructure component was changed to take into account the maximum amount of electricity consumed. It was not directly comparable with the situation in 2021. With the War in Ukraine, and the difficulties faced by people in Continental Europe to access Russian gas, the energy component of electricity prices escalated, for those using spot prices. The government provided consumers with support which amounted to 80% (in summer) or 90% (in winter) of the amount that exceeded NOK 0.70 per kW/h.
Because of our fixed price agreement, we were spared price increases for most of 2022. On 2022-12-01, a new fixed price agreement took effect. Before the infrastructure component, and subsidies, the energy component of 1 kWh of electricity now cost NOK 1.00, five times the price the year before.
A year later, on 2023-11-07, Trish received her next annual SMS from our electrical company. They wanted to know if we wanted to renew our fixed price contract for another year, with a kWh price of NOK 1.0015, or go over to a spot price, they claimed was currently at NOK 0.42.
She replied to the SMS with a positive answer. There are two reasons for this. First, we don’t want to worry about choosing the correct hour to use electricity. Second, we are uncertain if the relatively cheap prices will continue. Some hours after answering, NRK, the Norwegian Broadcasting Corporation, could tell us that the spot prices in our region on that same date, were not NOK 0.42, but NOK 1.14 at their lowest at 02:00 in the morning, but had increased to NOK 2.77 by 18:00. They then fell to NOK 1.71 at 22:00.
Reflection
As I write this ragged post, I read in 2023-07 the world has never been hotter for 120 000 years = 3.786912 Ts for SI addicts, or a very long time for the rest of us. Industrialization forced the world into a dependence on fossil fuels, coal initially then petroleum. Overcoming this dependency has not been easy. Nuclear power has been one proposed answer, but its waste products put demands on future generations that last thousands of years. Hydrogen has been proposed as an energy bearer, but its use increases energy consumption.
Each form of sustainable energy has its own individual challenges. Communities can choose their poison based on what is best for them. Among the choices are solar, wind, hydro and geothermal, or some combination.
In Europe, with a war waging in Ukraine, and the region still dependent on fossil fuels, there are countries, companies and individuals seeking profit maximization. Governments, possibly out of a fear of losing access to this energy, are unwilling to tax war profiteering. Indeed, one sees that they are in the pockets of international investors.
In democracies, as well as more autocratic countries, politics has become a career choice. This is wrong. I have nothing against a person working as a politician for, say, four/ five years. However, at the end of that time, they should return to other forms of earning a livelihood, and be quarantined from further political activity for at least twice the length of their political period. Just as there is a minimum age to vote, or be elected to office, there should be some maximum age. A start age of about 20, and an end age of about 65 would allow the most enthusiastic people to work as politicians for about 15 years, and in other occupations for a further 30.
In much the same way that there should be minimum wages, that should mirror living wages, it would be useful for the world to set a maximum income.
Reddy Kilowatt Update
Reddy Kilowatt
Art Vaughan wrote: “The hydro plant in Appleton has been one of the things the city fathers … and mothers? … have long trumpeted. However, when I was in the fourth grade or so my class went through the “modern” hydro plant in Appleton. Much more impressive and I still have the Reddy Kilowatt pin they gave us!”
Reddy Kilowatt (see above) is drawn as a stick figure whose body, limbs, and hair are made of stylized lightning-bolts and whose bulbous head has a light bulb for a nose and wall outlets for ears. It was devised by Ashton Budd Collins Sr. (1885 – 1976), and first used in an advertisement for the Alabama Power Company on 1926-03-14. It was used as a spokesperson for electrical generation in the United States (and elsewhere, such as Canada) from 1926 to 1999, although usage started to sag in the 1980s.
This post was originally called Digital Power Transmission. It began with content about the use of artificial intelligence (AI) to find faults in electrical power assets in Kansas and Missouri. That introduction became ancient history on 2023-10-26, when I read an article about pigeons using the same approach as AI to problem solving. I wondered if pigeons would make AI more understandable.
So, now this post begins with a scientific study of pigeons!
Pigeons
Columba livia domestica, has been found in records that are 5 000 years old. Its domestication is far older, possibly stretching back 10 000 years. Among pigeons that are bred specifically for particular attributes, homing pigeons are bred for navigation and speed.
Pigeons are able to acquire orthographic processing skills = the use of visually represented words/ symbols, and basic numerical skills equivalent to those shown in primates.
In Project Sea Hunt, a US coast guard search and rescue project in the 1970s/1980s, pigeons were shown to be more effective than humans in spotting shipwreck victims at sea.
A study was undertaken at the University of Iowa, by Brandon Turner, lead author, a professor of psychology, and Edward Wasserman, co-author and a professor of experimental psychology. 24 pigeons were given a variety of visual tasks, some of which they learned to categorize in a matter of days, and others in a matter of weeks. The researchers found evidence that the mechanism pigeons use to make correct choices is similar to that AI models use to make predictions. Using AI-speak, nature has created an algorithm that is highly effective in learning very challenging tasks, not necessarily fast, but with consistency.
On a screen, pigeons were shown different stimuli, like lines of different width, placement and orientation, as well as sectioned and concentric rings. Each bird had to peck a button on the right or left to decide which category they belonged to. If they got it correct, they got a food pellet; if they got it wrong, they got nothing.
Pigeons learn through trial and error. With simple tasks, pigeons improved their ability to make right choices from 55% to 95% of the time. With more complex challenges, accuracy increased from 55% to 68%.
In an AI model, the main goal is to recognize patterns and make decisions. Pigeons do the same. Learning from the consequences of being given a food pellet (or not), they show a remarkable ability to correct their errors. Similarity function is also at play for pigeons, by using their ability to find resemblance between two objects.
Those two mechanisms alone, can be used to define a neural network = an AI-machine that solves categorization problems.
The area served by Evergy, a Topeka, Kansas based electric utility company.
Back to the original content, Digital Power Transmission
Now, this post will examine the use of AI, and other digital technologies, in electrical energy transmission. Sometimes one has to venture outside of one’s backyard, to gain new insights. Today, the focus is on the Kansas and Missouri. More than four percent of this blog’s readers have roots in Kansas, in Leavenworth and Riley counties, making it one of the “big six” American states. The others being (in alphabetical order) Arizona, California, Michigan, New Hampshire and Washington. Yes, this weblog does have American content, because – sometimes – Americans are at the forefront.
Much of the initial work into the use of AI in grid management was done by Argonne National Laboratory, of Lemont, Illinois. After conducting AI grid studies, they stated that: “In a region with 1 000 electric power assets, such as generators and transformers, an outage of just three assets can produce nearly a billion scenarios of potential failure.” The calculation actually being: 1 000 x 999 x 998 = 997 002 000, which is close enough to a billion, for most people.
The Norwegian company, eSmart Systems, with its headquarters in Halden, bordering Sweden, in south-eastern Norway, provides AI based solutions for the inspection and maintenance of critical infrastructure related to electrical power generation and distribution.
Note: the term, asset, as used here, generally refers to a large structure, such as a electrical power generating station, or a substation, that transforms voltages (and amperages). For me, an asset will always be an accounting term, associated with the credit (left) side of a balance sheet, in contrast to a liability on the debit (right) side. My preferred terminology would be structure, works or plant.
eSmart
In this project eSmart will act as project management lead alongside engineering consultants EDM International, Inc. of Fort Collins, Colorado and GeoDigital, of Sandy Springs – near Atlanta – Georgia. Together, these will provide large-scale data acquisition and high-resolution image processing.
eSmart Systems is working with Evergy, a Topeka, Kansas based electric utility company that serves more than 1.6 million customers in Kansas and Missouri, to digitize Evergy’s power transmission system. It is also working with Xcel Energy, based in Minneapolis, Minnesota, and an unnamed “major public utility in the Southeast” of the United States.
Grid Vision tracks the performance of ongoing inspection work, provides instant insight of the location and severity of verified high-priority defects, and provides utility managers and analysts a deep and flexible framework for further asset intelligence.
The three-and-a-half-year-long Evergy project will improve reliability and resiliency of over 14 000 km of Evergy’s power transmission system by using Grid Vision to create a digital inventory of its assets, accelerating image analysis capabilities, and improving inspection accuracy by using AI combined with virtual inspections. The expected result is a significant cost reduction for inspections, maintenance and repairs.
There is a need for a dynamic energy infrastructure to ensure efficient, safe and reliable operations. AI, and especially machine learning, are increasingly used as tools to improve the reliability of high-voltage transmission lines. In particular, they can allow a grid to transition away from fossil and nuclear sources to more variable sources, such as solar and wind. This will become increasingly more important for several reasons. Extreme weather will offer increasingly more challenging operations, and the grid will have to support an increasing number of electric vehicles.
The vast number of choices means that random choices cannot be relied upon to provide results when facing multiple failures. Some form of intelligence is needed, human or machine, real or artificial, if problems are to be resolved quickly.
Wind and solar generation
Kansas state senator Mike Thompson (R-Shawnee), is a former meteorologist, who is currently chair of the Kansas Senate Utilities Committee. He has introduced bill SB 279, “Establishing the wind generation permit and property protection act and imposing certain requirements on the siting of wind turbines.” This bill would require wind and solar farms to be built on land zoned for industrial use. The problem with this proposal is that half of Kansas’ 105 counties are unzoned. These counties that want wind or solar energy would have to be zoned as industrial.
The Annual Economic Impacts of Kansas Wind Energy Report 2020, reports that wind energy is the least expensive energy source, providing 22 000 jobs (directly and indirectly). After Iowa, Kansas ranks second in the US for wind power, contributing 44% of Kansas’s electricity net generation.
Typically, there are two reasons for objections to wind and solar power. First, some people have an economic connection with fossil fuels. Second, and especially for wind, they don’t like their visual and aural impact on the environment.
Another source of conflict is aboriginal rights. This topic will be covered in an upcoming but unscheduled post, Environmental Racism.
Taipei Energy Hill solar park from above, taken with a DJI Mavic Mini drone. Photo: Anders J, 2020-07-15.
Starting in the mid 2000s, I often introduced students in my science classes to sustainable energy by referring to Desertec, a non-profit foundation that focuses on the production of renewable energy in the desert regions of north Africa. Initially, the project relied on concentrated solar energy to produce thermal energy = heat that could be stored in salt. This thermal energy was then to be used to produce electricity. The aim was to create a global renewable energy plan based on the concept of harnessing sustainable powers, from sites in Africa and the Middle East where renewable sources of energy are more abundant, and transferring it through high-voltage direct current transmission lines to consumption centers, in Europe.
I lost interest when this proved to be uneconomic, and thus unworkable. The foundation’s next idea was to focus on meeting domestic demand. This also failed because of transportation and cost-inefficiency issues. The initiative was revived in 2020 with a focus on green hydrogen, catering to both domestic demand and exports to foreign markets. This failed to spark my interest, because I regard the transport of a product (in this case, hydrogen) to be more problematic than transporting electrical energy.
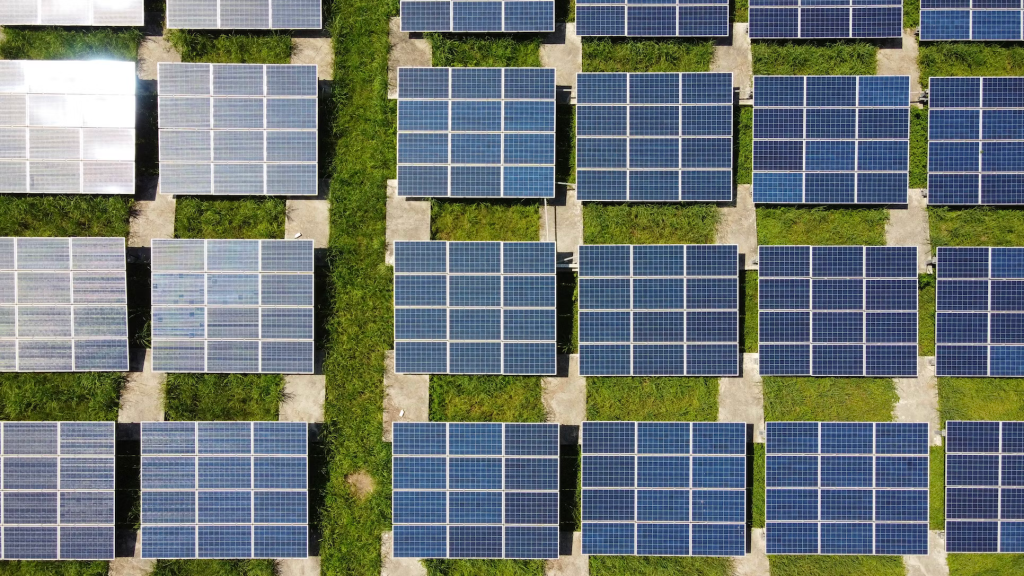
One of the main reasons why Desertec faces problems, is that since the early 2000s, solar cells and panels have become increasingly inexpensive, and provide some of the cheapest sources of electricity on the planet. They can be effectively used in most places where people live.
The solar cell was invented when Russell Shoemaker Ohl (1898 – 1987), a researcher at Bell Labs, noticed in 1940 that a cracked silicon sample produced a current when exposed to light. He patented the modern solar cell, described in US Patent 2402662, “Light sensitive device”, filed in 1941.
Martin Green (1948- ), was born in Brisbane, Australia, where he also received a B.Sc. degree from the University of Queensland, before and completed his PhD at McMaster University in Hamilton, Ontario, Canada, where he specialised in solar energy. In 1974. he returned to Australia, where he worked at the University of New South Wales. In 1975, he started a photovoltaic research group, using unwanted scrounged equipment.
Green and his students first worked to increase the voltage of solar cells. When this came up to a satisfactory level, focus was changed to quality improvement and energy efficiency. By 1989 the lab had built solar panels capable of running at 20% efficiency. In 2015, they achieved a 40.6% conversion rate using focused light reflected off a mirror.
Shi Zhengrong (1963 – ) was born in Yangzhong, Jiangsu, China. He completed his undergraduate studies at Changchun University of Science and Technology, and obtained his Master’s degree from the Shanghai Institute of Optics and Fine Mechanics, at the Chinese Academy of Sciences. Afterwards, Shi obtained a Ph.D. in solar power technology at the University of New South Wales. School of Photovoltaic and Renewable Energy Engineering. In 2001, Shi returned to China and set up Suntech Power in Wuxi with $6m in start-up funding from the municipal government.
Suntech made inexpensive, conventional PV solar panels with 17% efficiency. SunTech increased its production capacity from 60 megawatts (MW) to 1 gigawatt in 2009. This was possible because Germany, and other mainly European Union (EU) countries passed legislation encouraging solar power. This resulted in a massive global demand. By 2012, the world market faced excess solar panel supplies, which reduced prices to below cost. After an investment scandal, SunTech was bankrupt by 2013-03.
Other companies ensured continued production of low cost, highly efficient solar panels. The International Energy Agency reports that solar is providing the cheapest energy the world has ever seen.
The problem with solar energy is that it is available only half of the time. However, when that half occurs is largely dependent on latitude. Many producers of solar cells set 60°, as a northern (and southern) limit for their effective use.
Location
Vangshylla
New Westminster
Oakland
Latitude
63° 17′ 0″ N
49° 12′ 25″ N
37° 48′ 16″ N
PV Out
853.0
1235.2
1728.5
DNI
769.3
1336.4
2146.9
GTI optimal
992.9
1474.9
2117.1
Tilt opt
43
37
33
Summer solstice sunrise
02:48:50
05:05:48
05:46:58
Summer solstice sunset
23:45:58
21:21:08
20:34:52
Summer solstice daylight
20:57:08
16:15:20
14:47:54
Winter solstice sunrise
10:03:51
08:03:28
07:20:30
Winter solstice sunset
14:53:15
16:16:01
16:53:53
Winter solstice daylight
04:19:54
08:12:33
09:23:33
PV out can be regarded as the photovoltaic power potential; that is, the relative potential of a location to produce electricity from a solar panel. In the table above, Oakland has twice the capability of Vangshylla, while New Westminster has an intermediate position.
DNI = Direct Normal Irradiation, and is measured in kWh/m2 per year. Here, Oakland can produce three times as much electricity as Vangshylla. GTI = Global tilted irradiation at optimum angle. By setting solar cells at an optimal angle, the amount of electricity produced can be enhanced, considerably in high latitudes. However, to make matters worse, high latitude locations have most of their production in the summer months (when it is needed the least), with very little production in the winter (when it is needed most). At Vangshylla the length of the day varies by 16h:37m:14s. In Oakland, that difference is only 05h:24m:21s.
Note: Most of the content was written on or before 2021-04-25. It was updated immediately prior to publication.
The installation of electricity networks is essential for social and economic development. Important buildings in every community, such as schools and hospitals, run better with electricity. Roads become safer, and electricity can be used to give people access to clean drinking water.
A lack of electricity imposes social injustice. Admittedly, I am just a kid of 74, but I have never understood how the world has avoided imposing a universal tax to ensure that everyone has basic services/ infrastructure, such as electricity, clean water, wastewater removal, roads, even the internet.
In terms of electricity:
Close to 1.5 billion people still have no access to electricity. The majority of them live in Asia and sub-Saharan Africa. 80 % of these live in isolated rural areas and are excluded from development policies.
Three billion people are still dependent on traditional energy sources (candles, paraffin lamps, wood, etc). These forms of energy are often harmful and cause 4,3 million deaths each year.
Sustainable Development Goal No. 7 adopted by the United Nations General Assembly is to “ensure access to affordable, reliable, sustainable and modern energy for all”.
In terms of water:
50 % of the world’s population still does not have access to adequate quantities of drinking water.
2,4 billion people, i.e. 30% of the world’s population, do not have access to adequate sanitation.
663 million people live without having a source of clean water.
The aim of Sustainable Development Goal 6 adopted by the United Nations General Assembly is to “ensure availability and sustainable management of water and sanitation for all”.
Helping to provide solutions
Electriciens sans frontières (ESF) = Electricians without borders, is a non-governmental international solidarity organization (NGO) created in 1986 and recognized as a public utility by the French Ministry of the Interior on 2013-05-23. It works towards equality of access to electricity and water in the world. It promotes economic/ human development using renewable energies.
Bruno Léchevin (1952 – 2020), a French union leader, is credited with starting ESF in 1986, asking workers in the French electrical sector to use their skills on international solidarity/ development projects, so that electrical energy could act as a developmental lever.
ESF’s goal is to improve the living conditions of the poorest populations, living with energy poverty. It leads access to electricity and water projects in many countries in Africa, South Asia and Latin America. ESF also intervenes during humanitarian crises, notably in the Philippines in 2013 and 2015 following typhoons Haiyan and Ruby; in 2015 in Vanuatu after cyclone Pam; in Nepal after the Gorkha earthquake in 2015; in Haiti after earthquakes in 2010 and 2016; and in 2017 in Saint Martin and Dominica following the passage of hurricanes Irma and Maria.
Since 2017-12-19, ESF has been a partner of the Le Centre de crise et de soutien (CDCS) = Crisis and Support Center, to intervene in the event of a humanitarian crisis.
CDCS was founded in 2008, and is a department of the Ministry for Europe and Foreign Affairs (MEAE). It is responsible for monitoring, anticipating, alerting and managing crises taking place abroad and requiring actions in response to a humanitarian emergency, and post-crisis stabilization support. Admittedly, it is specifically concerned about events that threaten the safety of French nationals abroad.
Within the CDCS system, ESF intervened after the Celebes earthquake in Indonesia in 2018; after cyclone Idai in Mozambique in 2018; in Lebanon in 2020, after the port of Beirut explosions.
ESF receives financial support and contributions in kind (labour, equipment, working space) from individual donors, companies, private foundations and public institutions. Volunteer work by members are significant, and represent more than that provided as financial aid.
ESF received the UN Climate Action Award at COP25, for its achievements on the island of Dominica. It received the Zayed prize for sustainable development, following its training program in a Rohingya refugee camp in Bangladesh.
ESF has defined a vast intervention program for African health care centres, whee each requires an individual response. Needs include: rehabilitation of solar photovoltaic production plants, and even emergency generators in certain cases, in order to guarantee a reliable electricity supply; the refurbishment of interior electrical installations, in order to prevent electrical risks and to allow the use of high-performance medical equipment; installation of surge protectors to protect solar power plants in case of storms; electrification and lighting of additional spaces to increase facility capacity; the provision of refrigerators and respirators; installation of solar pumps to meet water needs; deployment of solar street lights to secure access to health care centers. Starting in 2020, ESF launched programs in 8 African countries: Togo, Burkina Faso, Mali, Cameroon, Senegal, Benin, Niger and Madagascar.
Because the protection of human lives is its first priority, ESF is currently asking for funding to support its work in Ukraine. Their mobilization aims to be strong and long-lasting, but requires external financial support to effectively meet assessed needs.
The French model has been replicated: In Germany, by the NGO Elektriker ohne Grenzen (2012); In Italy by Elettrici senza frontiere (2015); in Spain by Electricistas sin fronteras (2016); In Switzerland by Electriciens sans frontières – Suisse (2018).
The North American (USA and Canada) NGO, Electrical Workers Without Borders in North America (EWWBNA), joined the international network in 2017. Its founding in 2016 is attributed to the efforts of Edwin D. Hill (1937 – 2018) who, as retired international president of the International Brotherhood of Electrical Workers (IBEW), built up the organization. Unfortunately, the EWWBNA devotes about half of its website as a eulogy to its founder, which is an inappropriate resource allocation.
These six ESF organizations have signed an agreement specifying their mutual engagements.
Part of the reason I became attracted to ESF are its videos, made by another French NGO, Sikana TV in collaboration with ESF. These provide an introduction to electrical work, so that young people can understand what it entails.
Sikana was founded in 2014 with the aim of equipping people with practical skills through free educational video programs. They observe: that billions of people do not have access to teachers to help them acquire basic skills, unlock their potential and lead happy and dignified lives; three billion people have access to screens that can be transformed into tools for instruction. Video is a powerful and cost-effective medium to promote skill acquisition, as well as health and environmental awareness.
Numbers: 400 million lessons delivered to 230 countries on 2 300 videos in 16 languages with 75 pedagogical programs. They gather communities of volunteers and expert organizations to co-create educational solutions. These are involved in the entire creation process: writing, production, dubbing, dissemination, and development of IT tools. They create pedagogical programs on a wide range of topics: Health, environment, vocational skills, sports and more. Innovative technological tools enable people to collaborate and design content, translate and subtitle it and to make it available to the widest possible audience.
Factory is Sikana’s collaboration tool, allowing volunteers to translate and subtitle educational videos, from their homes. People who are fluent in at least 2 languages can help translate videos that can then be used to provide subtitles and dubbing. Both are needed because some people are illiterate, and cannot read subtitles, while others have hearing disabilities, and cannot hear dubbing.
Digital content is uploaded on the sikana.tv website and shared with partners who disseminate the content in the field. These partners include: Library Without Borders, Learning Equality, Electricians Without Borders, and the Digital Empowerment Foundation.
Sikana France has offices in Paris, Sikana Brazil has offices in Rio de Janeiro, Sikana India has offices in Pondicherry, Sikana Mali has offices in Bamako, and Sikana China has offices in Fuzhou.
The Electricity for Everyone series provides practical lessons to help anyone install electricity in their own residence. Topics are divided into five chapters: 1. An Introduction to electricity (8 videos); 2. How to Prepare Your Workspace (2 videos); 3. Electrical Boards (7 videos); 4. Lighting and Connections (7 videos); 5. Making-Of (1 video). The video lessons are suitable for two main groups of people. First, as a means of introducing individuals to the principles of electricity and to basic circuitry. Second, as a teaching aid to be used by trained electricians, to pass on their electrical knowledge/ skills/ insights to people who need it the most – particularly in the developing world and areas where access to electricity is unstable.
The videos emphasize risks when installing electricity and how to avoid them, how to save energy and how to get the most out of your electrical household appliances.
Another co-operative venture between Sikana and ESF consists of three videos about the installation of solar panels in the Discover Renewable Energy series.
A third series, Lower Your Energy Bills, does not involve ESF, but has been produced with the assistance of the Energies Solidaires organisation, and Energio, a research centre specialising in managing and economizing energy consumption. It is particularly concerned with fuel poverty. It is divided into five chapters: 1. Eco-tips (4 videos); 2. Saving on Your Heating Bills (3 videos); 3. Know Your Energy Consumption (4 videos); 4. Insulating Your Home (5 videos); and, 5. What is Fuel Poverty? (3 videos).
All of the videos produced by Sikana are free to watch and share. They can also be downloaded directly from the video player.
The above title is designed to attract curiosity. Yes, it could be the name of a band, but it isn’t. Instead, it involves a proposal to take a potential recycling challenge and to turn it into an electrolyte for use in electric vehicles and integrated battery systems, equivalent to the Tesla powerwall.
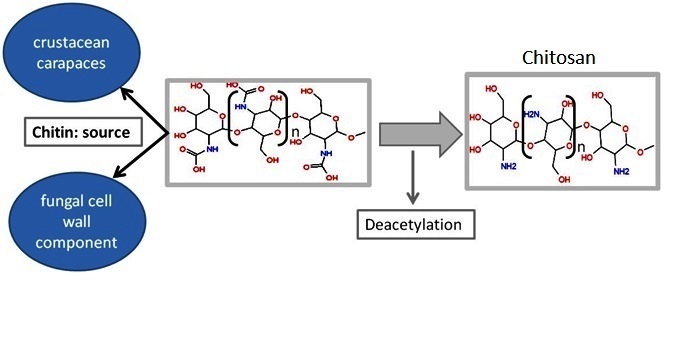
Chitin is found in fungi, insects and crustaceans, such as crabs, shrimps and lobsters. It is a polysaccharide = sugar, that makes shells hard and tough. However, because large quantities of crustacean chitin is discarded as food waste, its use has been researched in a variety of applications. In biomedical engineering, for example, it is used as a wound dressing, or as an anti-inflammatory treatment.
By adding acetic acid = vinegar, and processing it chemically (deacetylation), chitin can be synthesized into a gel membrane that can be used as a battery electrolyte = the liquid/ paste/ gel inside a battery that conducts electric current, using ions = positively and negatively charged particles that migrate towards the negative (cathode) and positive (anode) terminals, respectively, allowing it to store energy. This transformation is shown in the illustration below.
The formation of chitosan from chitan using acetic acid. Source: Vicente Neto
When this electrolyte is combined with zinc, it can create a cheap, non-flammable and renewable battery. After 1 000 cycles, the battery is still 99.7% energy efficient. This contrasts with Li-ion batteries, where such a large number of battery cycles can significantly degrade the battery. This is a rare battery characteristic, allowing these batteries to operate at high current density.
Another advantage of a chitin based battery, is that microbial degradation in soil can break down the battery in about five months, leaving zinc behind as a recyclable product.
Notes:
A University of Maryland press release, provides source information about the chemical process for anyone wanting to investigate this topic further.
Report Summary: Rechargeable aqueous Zn-metal battery is promising for grid energy storage needs, but its application is limited by issues such as Zn dendrite formation. In this work, we demonstrate a Zn-coordinated chitosan (chitosan-Zn) electrolyte for high-performance Zn-metal batteries. The chitosan-Zn electrolyte exhibits high mechanical strength, Zn2+ conductivity, and water bonding capability, which enable a desirable Zn-deposition morphology of parallel hexagonal Zn platelets. Using the chitosan-Zn electrolyte, the Zn anode shows exceptional cycling stability and rate performance, with a high Coulombic efficiency of 99.7% and >1,000 cycles at 50 mA cm−2. The full batteries show excellent high-rate performance (up to 20C, 40 mA cm−2) and long-term cycling stability (>400 cycles at 2C). Furthermore, the chitosan-Zn electrolyte is non-flammable and biodegradable, making the proposed Zn-metal battery appealing in terms of safety and sustainability, demonstrating the promise of sustainable biomaterials for green and efficient energy-storage systems.
While originally written 2022-09, publication of this post has been delayed to coincide with the Sharm el-Sheikh Climate Change Conference (COP27) held 2022-11-06 to 18. Politicians love such conferences, using them to receive undeserved publicity for making big promises, that they have no intention on keeping.
Because climate change is real, my hope is that people will:
Use the coming year to find ways to reduce their carbon footprint.
Hold their politicians accountable.
It is also hoped that some, select few people will find this battery concept so interesting that they will use some of their free time to develop an open-source battery. Should one be developed, I am interested in purchasing a 50 kWh battery system, to provide backup when the grid decides to go offline. I would also appreciate being kept informed of developments.
With this weblog post (#451) published, I have 52 posts scheduled, and most of those have been written! In addition there are 71 weblog posts, in draft format, that remain unscheduled. To ease that situation, weblog posts will be published twice a week, on Saturday and Sunday, until the end of 2022. This will add seven posts to the publication schedule. Some of these deal with the 2022 United Nations Climate Change Conference (Cop27), currently being held at Sharm el-Sheikh, Egypt.
This weblog post is written to celebrate the upcoming 10th anniversary of Vortex Bladeless, as a concept, and the 81st anniversary of the collapse of the Tacoma Narrows Bridge on 1940-11-07. I have watched videos documenting the bridge collapse many times, and shown these to students in science classes over the years. Unfortunately, I lacked the insight of David Yáñez who was able to see the potential of oscillations in the generation of electricity.
David Yáñez and the Vortex Bladeless Tacoma at Avila, Spain in 2019. Photo: Vortex Bladeless.
Preliminary considerations
Living on a cliff-face, the residents at Cliff Cottage experience some wind, but less than many people might expect. The one-word reason is updraughts. That is, when the wind hits the cliff, it is deflected upwards, and then over the house. While the residents have considered installing horizontal bladed wind turbines at the cliff-face to provide electrical power, that take advantage of these updraughts, there is probably too little energy to make any investment economically worthwhile.
For example, a product was being offered on Kickstarter. On 2020-09-29, Nick Hodges, founder of Halcium, in Salt Lake City, UT, launched a funding round for (yet another device referred to as) a Powerpod, which was described as the “safest, most powerful wind turbine in the world”. He set US$ 200 000 as a minimum goal. When the fundraising period ended at the end of 2020-10, the goal was not met.
The product offered by Hodges, was not ideal for Cliff Cottage. The wind we are interested in using comes from one direction only, so being able to take advantage of wind coming from anywhere does not offer any advantages.
A major problem with the Kickstarter launch was an amateur approach to the electrical technology. After reading a description of the project, one was left with more questions than answers. Hodges apparently has a degree in small business management and an MBA with a finance emphasis from Arizona State University.
As another resident pointed out to me, entrepreneurship requires three competencies, finance (and related areas of business management), marketing and technical competence. From the material presented, it was obvious that Hodges had marketing competence, but lacked science and engineering skills.
For example, he claimed that Powerpods are “cheaper than solar panels and more efficient in places that get fewer than 300 days of sun a year.” When examining this statement, it is difficult to understand the specific apples and oranges being compared and contrasted. The number of square meters of solar panels is unspecified. Wind speed is an unknown factor, and there didn’t seem to be any documentation that related wind speed to power produced, only an attractive graph comparing power from a Powerpod with power from a normal wind turbine, whatever that is.
The number of days of sun is an unusual metric. Sunshine duration in hours per year is more common, something that can be determined using a World Meteorological Organization (WMO) standardized Campbell-Stokes recorder, which has been in common use since 1962. In 2003, the sunshine duration was finally defined as the period during which direct solar irradiance exceeds a threshold value of 120 W/m2.
There are claims that each 1kW in the Powerpod wind turbine creates up to three times more power than a regular, mounted turbine. The extra power comes from the blade system in the pod. While there is a graph showing this magic, there appear to be no supporting documents. There are no wind speed or power measurements, In fact, the graph incorrectly expresses power in volts, rather than correctly in watts.
The Powerpod system uses 12 Volt components. These are typically used on recreational vehicles to be compatible with vehicle electrical power systems. While they are used in residential systems, 48 V is quickly becoming the new standard. In part, this is because of the high amperage involved with 12 or 24 V. Transmitting 960 W of power with a 12 V system involves wiring capable of transmitting 80 A. With 48 V this is reduced to 20 A. Of course, if this power has to be transported any distance, it will have to be even thicker. Thick wiring is expensive and difficult to obtain.
Hodges goes on to compare wind and solar energy. In Norway it costs from NOK 30 000 to NOK 120 000 to have solar cell panels installed on an average single-family dwelling. This is typically financed by re-negotiating an existing mortgage. On average, the payback time for such an investment is about 17 years. The life-expectancy of the solar cell panels is from 25 to 50 years, and manufacturers offer a 25 year product guarantee on the solar cell panels, so that house owners do not face additional risks. Inverters may have a shorter life-span, and are not usually covered by the guarantee.
Unfortunately, the climatic situation in Norway means that solar panels can only produce substantial quantities of electricity during the summer. It is not that the equipment doesn’t work in the winter. Rather, the sun is close to the horizon, and not visible for many hours. On the date of publication, sunrise was at 08:16, sunset will be at 15:41. This gives 7h24m 43s of daylight. At the winter solstice (2021-12-21) daylight hours will be reduced to 4h17m21s. At the next summer solstice (2021-06-21) there will be 20h53m32s of daylight. Selling power usually requires one to participate in a spot-market, where prices are usually low in the summer, but high in the winter. Despite this, most people who install solar panels in one form or another want to connect to the mains in order to to sell excess electricity, or to access electricity when there is a production deficit. Batteries could be used, but new batteries are expensive. Some people will decide to buy discarded batteries from electric vehicles and store electricity with these. This is a more common model for cabin/ vacation cottage solar panels, less common for primary residences, because the cost is too large in relation to potential savings. Once again, people have risk aversion.
Another approach is to produce electricity in the summer and store it until it is needed in the winter. While the return-on-investment calculation for this looks good, mainly because of the high price for electricity in the winter, a large battery capacity is necessary.
Hodges’ main goal is admirable. He wants to reduce dependence on fossil fuel. He wanted to use the $200 000 funding to mass-produce Powerpods. The money sought would cover the cost of having the product tested, the raw materials for products being sold as part of the kickstarter project, as well as factory tooling.
After reading the project description, I was not totally convinced that Hodges had a viable product, or the necessary skills to make one. Hodges should partner with someone who has the necessary electrical engineering skills. This would allow for the development of the entire infrastructure needed for off-grid power production. These will have to meet agreed standards. At a minimum this consists of battery storage, a suitable inverter and a net metering system to allow produced energy to be used in the residence, or fed to the grid (especially at peak times). The equipment must be able to handle abnormal situations, such as power surges and power failures. The system should also prohibit sending power onto the grid, when it is down, as this could be potentially dangerous for crew members working to restore power.
There are also a number of legal issues that have to be negotiated, including energy purchase and sales agreements, and liability (including liability insurance). The specifics vary from jurisdiction to jurisdiction. Thus, it might be appropriate for Hodges to restrict his sales to Utah, and to find other people to cooperate with in other states, provinces and countries.
At Cliff Cottage we probably won’t participate in such a project. Instead, we will work slowly and methodically to find solutions that meet our specific energy needs. As a first step this will involve measuring wind speeds at the cliff face, to determine if wind energy is viable. If it is, then this process will slowly intensify as we select a more viable solution.
A More Viable Answer
The Vortex Bladeless turbine, popularly referred to as the Skybrator, has its origins in 2012 after David Yáñez watched a video of the Tacoma Narrow’s bridge oscillating in the wind. Since then, Vortex Bladeless, a Spanish tech startup, has been working to produce electricity from oscillations induced by wind.
Vortex Bladeless is a vibration resonant wind generator: It does not rotate, and is not a turbine, in contrast to the common horizontal-axis wind turbines (HAWT) and less common vertical axis wind turbines (VAWT) that work by rotation. Instead, it harnesses energy by allowing a fibreglass and carbon fibre reinforced polymer mast to oscillate in the wind, taking advantage of von Kármán vortices that form when a moving fluid (air) passes over a slender structure (the mast). At the bottom of the mast, a carbon fibre rod moves an alternator to generates electricity.
Wind turbines have issues, including maintenance costs, amortization rates, noise levels, bird deaths and other environmental impacts. Remote locations can have logistics challenges, while their visual and aural impact on a location is not always appreciated. The mass (and dimension) of vortex generators, indicate that they will use less raw materials in their construction compared to rotary wind turbines of the same power. They have a low centre of gravity that allows for a smaller foundation and less wake turbulence. Thus, they can produce more power (greater energy density) per unit of land area.
However, the market Vortex Bladeless envisions if for a small wind-turbine alternative for the end-consumer market and for low-power systems. These are markets that are served poorly (or not at all) by larger-scale wind turbine manufacturers.
Vortex Nano – 1 m high and 3 W nominal power output. For off-grid, low-power systems, especially with solar panels.
Vortex Tacoma – 2.75 m high and 100 W nominal power output. For small-scale residential/ rural autonomous operation, with solar panels.
Vortex Atlantis/Grand – 9–13 m high and around 1 kW nominal power output. For residential/ rural autonomous operation, with solar panels.
All of these are slender, vertical, cylindrical devices, composed of two main parts: a fixed base where the device is attached to an anchor, and a flexible mast which, acting as a cantilever, that interacts more freely with moving fluid (air) in an oscillating movement. The oscillator has no gears or moving parts in contact with each other, so there is no need for lubricants.
A linear alternator, with neodymium magnets and its stator is located inside the moving part of the device, converts mechanical to electrical (chemical) energy. During this process the alternator damps/ cushions the induced oscillation movements. These devices operate with minimal maintenance and operating costs.
Tacoma Narrows Bridge
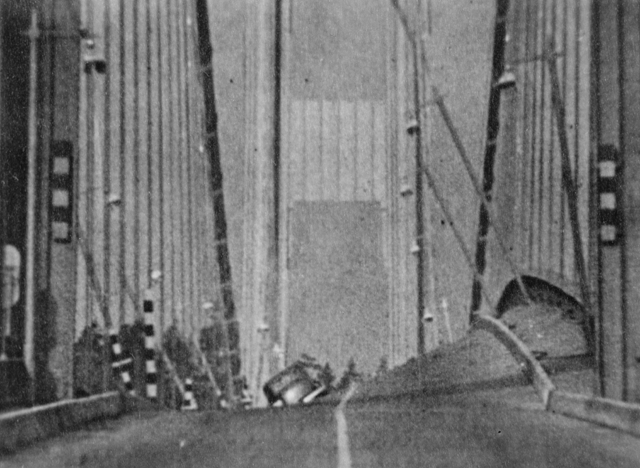
With newspaper editor Leonard Coatsworth’s car still on the deck, vertical and torsional motion was recorded on the Tacoma Narrows Bridge, 1940-11-07. Oscillations eventually destroyed the bridge. Credit: Library of Congress Prints and Photographs Division.
There is 1.4 km of Puget Sound separating Tacoma from Gig Harbor. Yet, before the construction of the Tacoma Narrows Bridge, one had to drive 172 km between them. With the bridge in place, this was reduced to 13 km. The bridge also linked McChord Air Field near Tacoma with the Navy shipyard in Bremerton, both important elements of the American military’s infrastructure, and probably the most critical one that allowed the funding of the bridge. Washington States bridge engineer, Clark Eldridge, had proposed a conventional design for the state highway department and Toll Bridge Authority. However, the federal Public Works Administration, insisted that bridge engineer Leon Moisseiff, designer of the Manhattan and Golden Gate bridges, be hired as the lead consultant and designer, and to use deflection theory as the basis of the design, producing a lighter, narrower, more flexible and cheaper structure.
Construction of the bridge started in 1938 and took 19 months. When finished, the Tacoma Narrows Bridge had an 853-meter-long centre span, almost half its total length. It was the third longest suspension bridge in the world, behind the Golden Gate and George Washington bridges. It also had the smallest ever width-to-length ratio: 1 to 72. Even before the bridge was completed the bridge deck shook in a wave-like vertical motion. This earned the bridge its nickname, Galloping Gertie. The bridge opened on 1940-07-01.
On 1940-11-07/ November 7th, 1940/ 7 November 1940, south-westerly winds, with gusts up to 68 km/h began to buffet the bridge. The deck began its customary rippling, bouncing up and down with more than a meter of displacement from its normal position at times. Shortly after 10:00 traffic was halted because of bridge deck oscillations. Soon after the bridge’s vertical movement was supplemented by a twisting motion that whipped the deck up and down to either side of the centre of the roadway. The twisting grew increasingly severe, with one sidewalk up to 8.5 meters higher than the other.
At 11:02., a 180-meter portion of the centre span gave way, crashing into the water below. Additional sections followed. The last major section fell at 11:10. With most of the centre span gone, all that was left were dangling suspension cables, a hole between the two towers and remnants of sagging side spans at either end of the bridge.
Earth magazine has an article that provides further information about this bridge failure.
In 2010 the number of people living without electricity was estimated to be about 1.2 billion. By 2019, this had been reduced to about 760 million. The most significant contribution to this reduction, was the installation of small solar systems, powering at village or household scale. According to the World Bank, about 420 million people currently get their electricity from off-grid solar systems. They estimate that by 2030, that number could increase to 800 million.
Unfortunately, such a metric hides more than it reveals. Having an electrical connection or even a solar panel does not necessarily imply access to electricity. On average, the sun is only available as an energy source about 12 hours a day. Energy access must also take into account reliability and affordability, and is most appropriately measured on a tiered spectrum, from Tier 0 (no access) to Tier 5 (the highest level of access).
Many people in emerging markets (and elsewhere) do not have enough money to pay for products in advance. Pay As You Go (PAYGo) models allow these users to pay for their products over time using technology enabled, embedded consumer financing. A PAYGo company typically offers a solar product, such as a solar home systems and multi-light pico devices. The customer makes a down payment, followed by regular payments for a term ranging from six months to eight years. Payments are usually made via mobile money, though alternative methods are sometimes available.
Productive use leveraging solar energy (PULSE) is defined as any agricultural/ commercial/ industrial activity that uses solar energy as a direct input to the production of goods/ services. PULSE enables/ enhances income generation by households/ farms/ microenterprises, often by mechanizing activities that would otherwise be performed manually or by providing additional hours of lighting in which to work. These activities and lighting might also replace non-renewable sources of energy, such as diesel generators or kerosene.
An especially important area for PULSE is for cold storage, refrigeration, and agricultural processing. This means there is a need for a large number of off-grid refrigerators, as well as products for solar milling. The World Bank, in its report, notes the need for specialized products for use in specific value chains such as poultry, dairy, and coffee. The PULSE segment is in its infancy, but has a potential for rapid expansion.
Key trends in emerging markets from 2020 onwards include: 1) Hardware manufacturing and design. Manufacturers are improving product quality, and developing brands for emerging markets; they are providing lower-cost products at consistently higher quality levels. 2) Software development. Software offers customizable and open architectures, that encourages PAYGo models and platforms. 3) Marketing and distribution. While large international companies are leveraging data to optimize sales and distribution, hardware companies are partnering with local distributors to reach previously underserved markets. 4) Consumer financing. PAYGo is encouraging innovation for payment systems. Companies are partnering directly with financial institutions to decouple consumer finance from their business models. 5) After-sales support. Remote monitoring is enabling companies to improve customer service and asset management. They are incorporating e-waste disposal considerations into business models.
The Chinese Belt and Road Initiative is a global infrastructure development strategy adopted by the Chinese government in 2013 to invest in nearly 70 countries and international organizations. Participants involve about 65% of the world’s population. Many of the countries participating are in emerging markets. Here, and elsewhere, Chinese manufacturers will sell higher-quality, self-branded products through local distribution partners and increasingly through their own distribution networks, including on PAYGo. This will increase the amount of high-quality, but lower-cost, products reaching these markets.
What should families in the developing world/ emerging markets do to obtain reliable supply of electrical energy? In many places, utilities (public and/ or private) are unreliable, while new solar panels are too expensive. From about 2010 to 2020, the obvious solution was to buy used solar panels. These panels become available because, in the more developed world, there is economic pressure to make optimal use of roofs and other surfaces, to produce as much power per surface area. This meant the regular replacement and subsequent sale of sub-optimal solar panels. Energy Bin has about 5 million pieces of photovoltaic equipment available on their site, and there are estimates that about 10 million used solar panels are available at any given time, on the global market.